Brain Atlas / 2026-10-10 / corrected 13 October / Methods
The platform, today · 10 October
70.367 seconds · 1920 × 1080 · 30 frames per second · silent
Corrected 13 October 2026. The original reel's growth excerpt at 58–66 seconds and mass-effect excerpt at 72–79 seconds drew tumour density through a displacement field that did not match their mass models. Both excerpts are removed, including their dissolves and an additional frame at each boundary. The faulty images have not been replaced by a new model result.
The remaining twelve scenes retain their order, captions and source images. They come from separate studies with different data, models and clocks; their sequence does not connect them into one biological simulation. The film remains silent, and source images are fitted without cropping. Existing dissolves remain; the two removal joins are hard cuts.
The remaining tract-spread simulation still allows tumour cells into the brain's fluid spaces. It has no mass-displacement field and is separate from the removed renderings. This correction doesn't affect its comparison on 74 LUMIERE patients (scene 11). The proton-plan scene is an independent dose calculation.
Source playback seconds and simulated time are different. The listed reel intervals include surviving dissolves, so neighboring scenes can overlap. Displayed interval endpoints are rounded to the nearest millisecond from the 30-frame-per-second edit.
01 / 0–9 s · simulated + illustrated
Patterns carried by a current
Gray–Scott / Pearson 1993 · Lattice Boltzmann / Qian 1992 · Brain Atlas
Gray–Scott reaction–diffusion (Pearson 1993) with one-way lattice Boltzmann flow (Qian 1992; Ginzburg 2008), coupled by the platform runtime. Fine chemistry grid 1024 × 512; model time is lattice steps, not physical seconds. Colour, lighting and display timing illustrated. Public producer film; no new simulation or camera capture.
Source film · Source playback 3–12 seconds.
Source file identity
SHA-256 65fb25b4667a9f88f0405f0ec41dbc80f8f8bf638fae14af6a7606fc3979843759,657,306 bytes
02 / 8.5–16.5 s · simulated + illustrated
From rest to effort
Pulse 4.4.0 · Kitware / Syn3A · Thornburg et al. 2026
CEBS b001 (PhysioNet) supplies the six-second recorded prefix. Pulse 4.4.0 (Kitware) supplies independent steady rest, 5 km/h walk and 8 km/h run loops after five minutes at each workload; joins are time jumps. This adult model reaches its modeled maximum, 166.7 beats/min, from 150 W. Illustrated Brain Atlas Body 2.0 torso; independent JCVI-syn3A metabolism replay (Thornburg et al., Cell 2026). This excerpt uses the run loop and its final independent bacterial-cell replay. The CEBS recorded prefix is not part of this shot. The two models are not a coupled human cell simulation.
Source film · Source playback 22–30 seconds.
Source file identity
SHA-256 a50da22efd11013d7fde378561060fc714f91d43fe907946faad7cc7bcf5ccf04,957,530 bytes
03 / 16–20 s · simulated + illustrated
Circulation: the earlier model
Pulse 4.4.0 · Kitware / Diagram · Brain Atlas
Pulse 4.4.0 (Kitware), adult male: independent steady rest, 33.84 W walk and 162.21 W run. Bands show estimated inflows; shares use mean left-heart ejection, with residual visible. Muscle gets 15–16%; heavy exercise gives 80–90% (Joyner & Casey, 2015; different workloads). MetabolicToneResponse line 2749 fixes metabolicModifier at 1.0, disabling its extra muscle dilation. Diagram: Brain Atlas.
Source film · Source playback 16–20 seconds.
Source file identity
SHA-256 7357717909dfcb2f7d3f6a1f323f3df066f53bda60e00d190643d8221bf3d90d2,263,445 bytes
04 / 19.5–25.5 s · simulated + illustrated
Circulation, one step closer
Pulse 4.4.0 · Kitware / platform iteration 3 · Brain Atlas
Pulse 4.4.0 (Kitware) vs Pulse 4.4.0 + platform patch (exercise hyperaemia, iteration 3). Both adults: steady rest/walk/run. Brain and coronary flow improve; kidney flow stays high, skin low. Female 240 W misses the pressure guard and is excluded. Ejection shares retain residual; muscle+limbs are a proxy. References: Joyner & Casey 2015; Anderson 1968 via Plowman & Smith ch.13. Diagram: Brain Atlas.
Source film · Source playback 24–30 seconds.
Source file identity
SHA-256 b9ce80dbd0e7dca2d327079e91df732225cdb7783786fcc55c84f82a779054ad3,512,788 bytes
05 / 25–31 s · real data + simulated + illustrated
Three ways to walk
GC4 · Fregly et al. 2012 / Rajagopal · OpenSim
Grand Challenge 4 knee-loads data, subject JW (Fregly et al. 2012, Stanford University): markers, knee goniometer, ground reactions and implant force. Rajagopal 2016 scaled to JW in OpenSim 4.6 (IK, ID, knee-aware static optimisation). The model-estimated force is the normal-walking average plus a weight on the model's change, fitted on normal walking only. Generic Rajagopal bones, no subject geometry. Generic bones are illustrated. The 25 fps published clip is resampled to 30 fps. Caveat: One person. The model-estimated force covers stance only; the bones are a generic model scaled to JW, not JW's own anatomy.
Source film · Source playback 0.5–6.5 seconds.
Source file identity
SHA-256 95ab7af2fbd5f5c1ecdee15594dbfd1e4e3bb149e7c95d3b7eed5270cd30f842737,322 bytes
06 / 30.5–36.5 s · real data + simulated + illustrated
Light through layers
Damagatla et al. 2026 / Duncan 1995/1996 · Giacalone 2017 / Brain Atlas
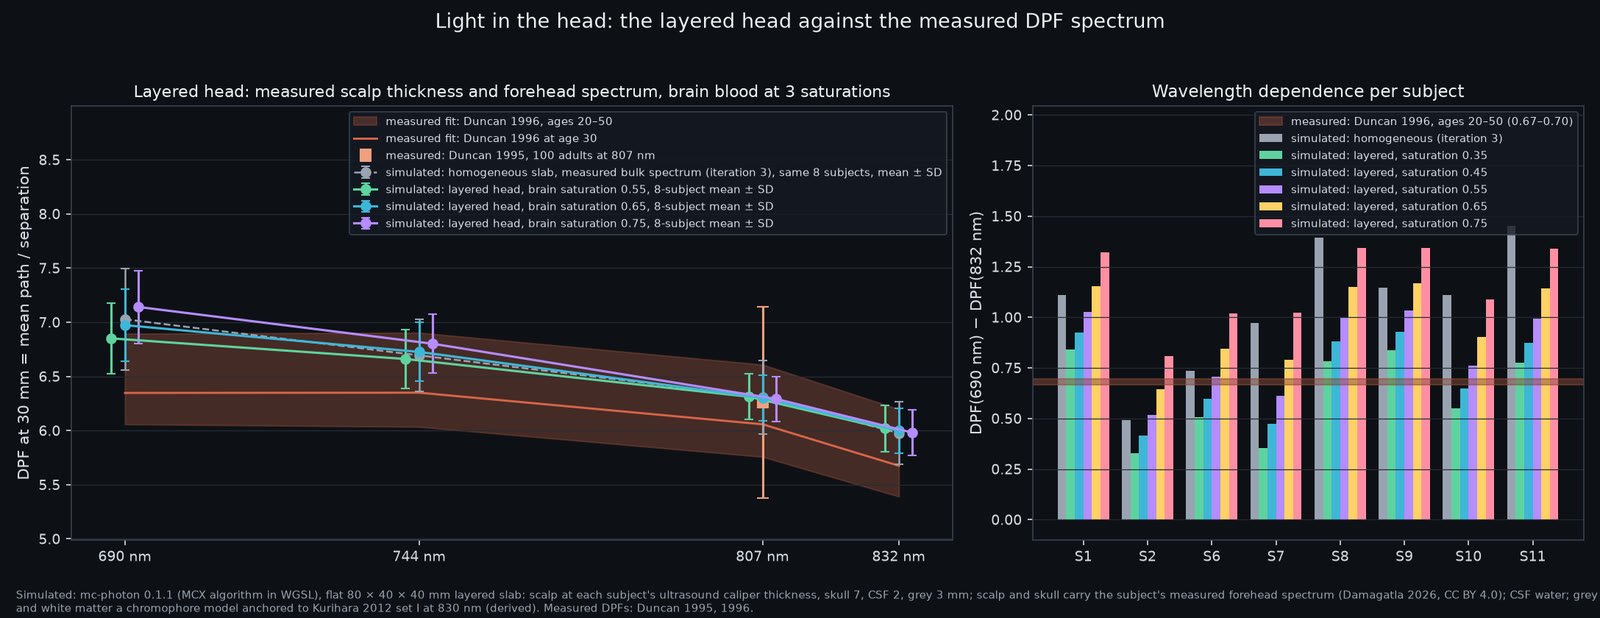
mc-photon 0.1.1 (the MCX voxel algorithm in WGSL) on an NVIDIA A40: layered 80 x 40 x 40 mm slab, scalp at each adult's ultrasound caliper thickness, skull 7, CSF 2, grey 3 mm; scalp and skull carry the adult's measured forehead spectrum, CSF water, brain a haemoglobin model with its oxygen saturation scanned 0.35-0.75; 128 runs of 5e7 packets. Labels: simulated (kernel), derived (layer model), measured (spectra, thicknesses, DPFs, StO2). Forehead spectra and scalp thicknesses: Damagatla et al. 2026, Scientific Data, doi:10.1038/s41597-026-06586-9, Zenodo 15828014. Optical pathlengths: Duncan et al. 1995/1996. Cerebral saturation: Giacalone et al. 2017. Layer geometry and display are illustrated. Charts only; no individual head surface. Caveat: The brain saturation is a fitted parameter, not a measurement; skull, fluid and brain properties are literature values stretched by a chromophore model; the slab is flat. The implied saturation (0.42 for the group, 0.24-0.67 across adults) sits below the 58 % measured in healthy adults for most subjects.
Source image · The full source image is fitted without cropping.
Source file identity
SHA-256 45c06a6aa39be0631b5678fb9384f3d46f314e6f38752f256e64174dd052e751186,455 bytes
07 / 36–42 s · real data + simulated + illustrated
Read it the way the instrument did
Damagatla et al. 2026 / Duncan 1995/1996 · Giacalone 2017 / Brain Atlas
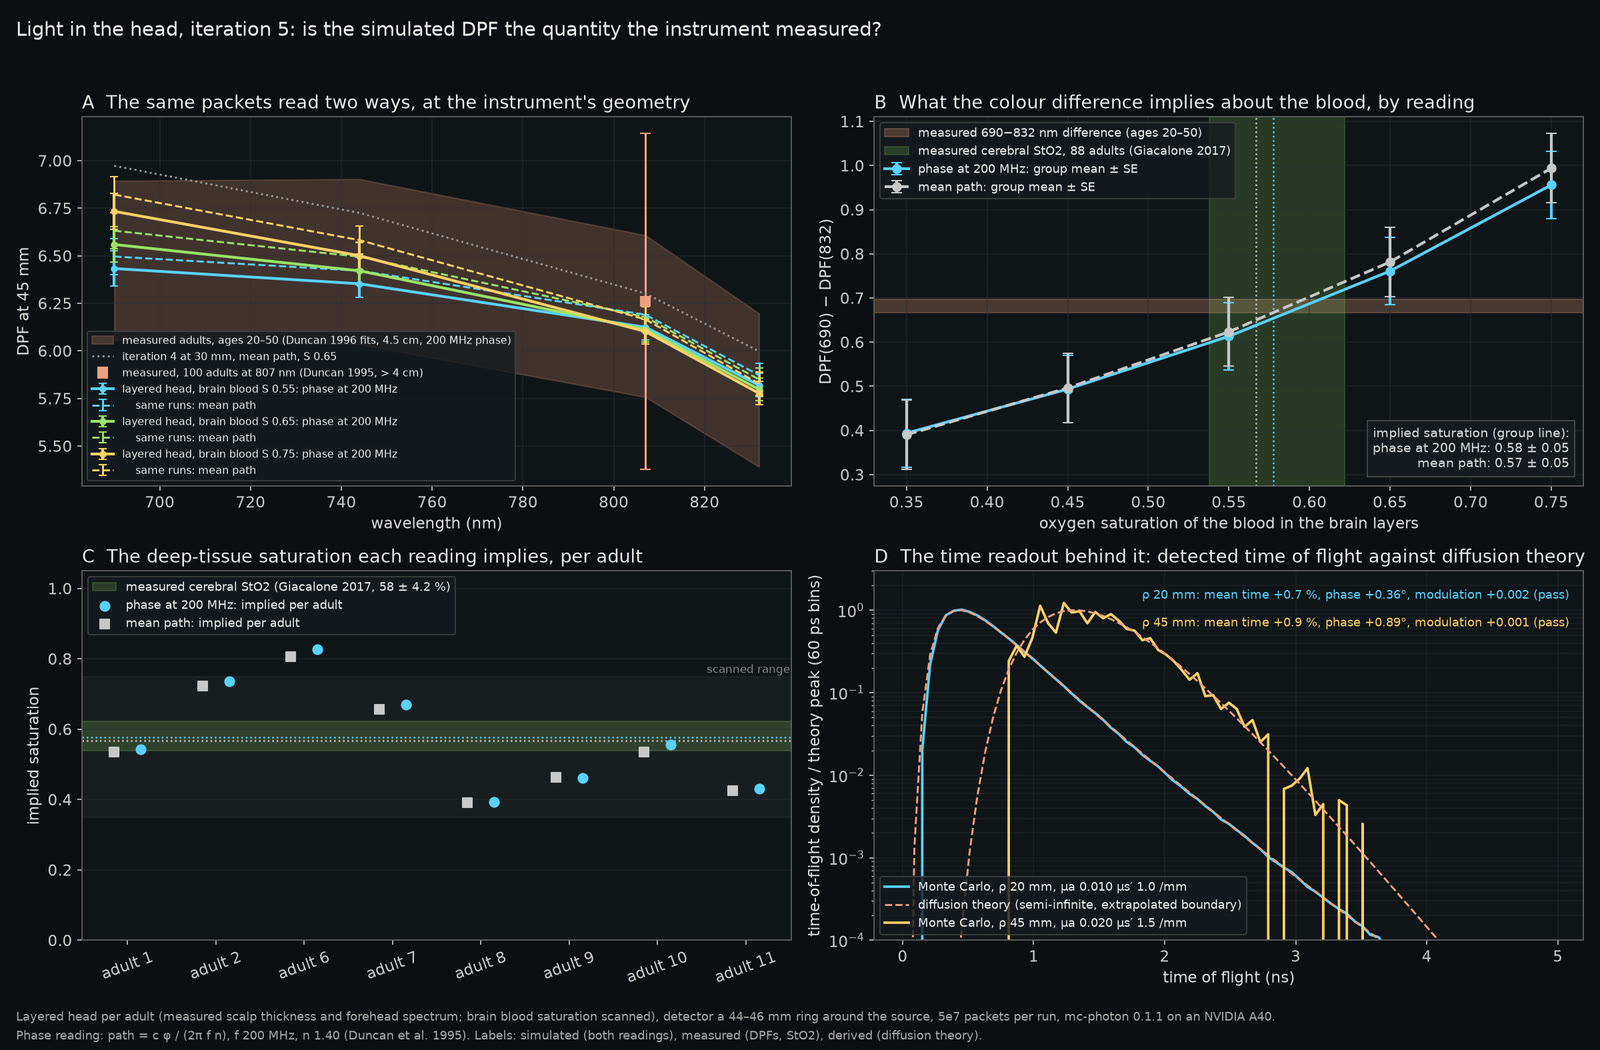
mc-photon 0.1.1 (the MCX voxel algorithm in WGSL) on an NVIDIA A40: each adult's layered head (measured scalp thickness and forehead spectrum; skull 7, CSF 2, grey 3 mm; brain blood saturation scanned 0.35-0.75), detector a 44-46 mm ring around the source, 128 runs of 5e7 packets, each read as mean path and as the phase of 200 MHz light. Labels: simulated (both readings), derived (layer model, theory), measured (spectra, thicknesses, DPFs, StO2). Forehead spectra and scalp thicknesses: Damagatla et al. 2026, Scientific Data, doi:10.1038/s41597-026-06586-9, Zenodo 15828014. Optical pathlengths: Duncan et al. 1995/1996. Cerebral saturation: Giacalone et al. 2017. Layer geometry and display are illustrated. Charts only; no individual head surface. Caveat: Eight adults' forehead spectra, one skull model for all (the forehead's own bulk spectrum), a flat slab, and the refractive index of the phase conversion taken as 1.4. Per adult the implied saturation spreads 0.39 to 0.83. The homogeneous slab and the 30 mm layered head of earlier cards are the comparators; this card supersedes their slope miss, not their levels.
Source image · The full source image is fitted without cropping.
Source file identity
SHA-256 23771b068d1505ae517bb01af8b138ac50132bf6f635584921a21555b3b09543313,519 bytes
08 / 41.5–47.5 s · real data + simulated
The source changes the field
UCL · Krokhmal, Simcock, Treeby & Martin 2025 / Brain Atlas
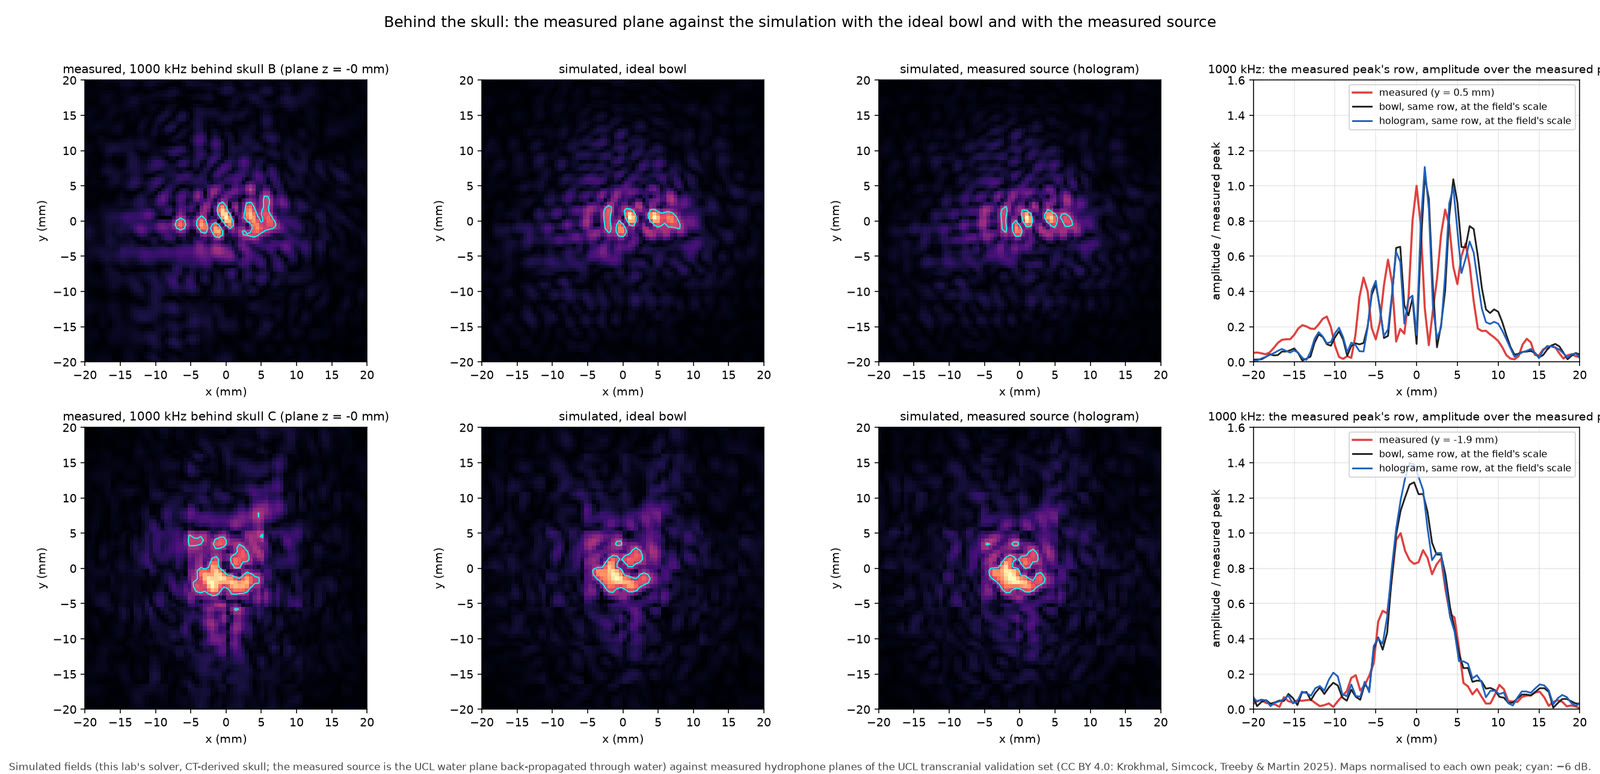
Our WebGPU solver on the UCL CT volumes at 0.2 mm (the paper's property recipe, 195 HU mask), driven by the ideal bowl and by the measured 1 MHz water plane back-propagated to a plane in front of the skull, each scaled by its own free-field solve and the session's axial line. Measured planes behind skulls B and C at 1 MHz, normalised to their own peak; cyan: −6 dB. Data: Krokhmal, Simcock, Treeby & Martin 2025.
Source image · The full source image is fitted without cropping.
Source file identity
SHA-256 73138a02057f95b11417d91ab47f5046c96279b4f6199c779e4be585acedb172242,188 bytes
09 / 47–53 s · real data + simulated
The loss each skull asks for
UCL · Krokhmal, Simcock, Treeby & Martin 2025 / Brain Atlas
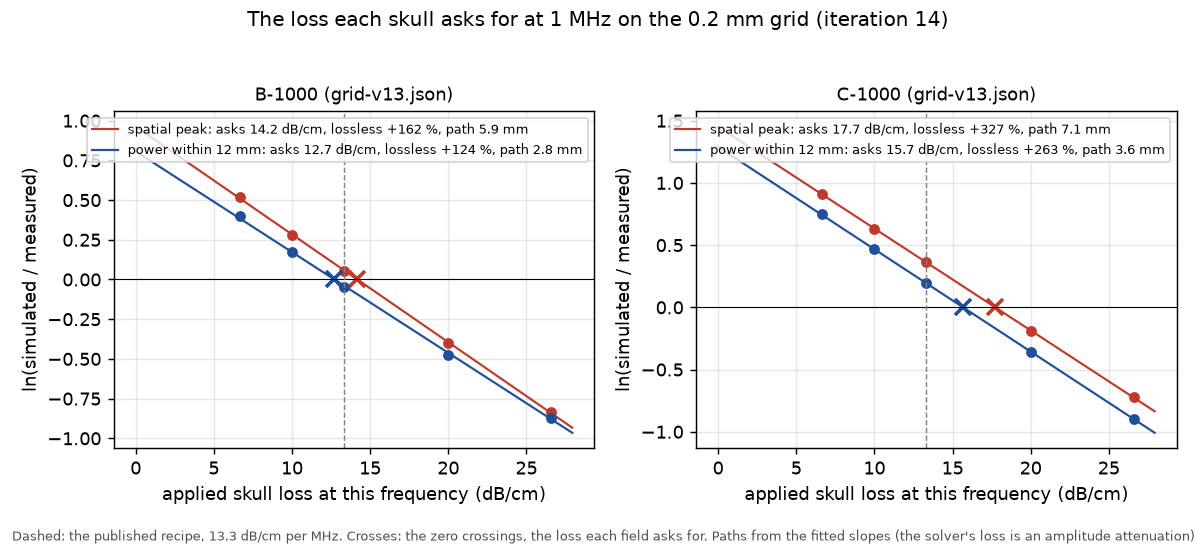
Our WebGPU solver on the UCL CT volumes at 0.2 mm (the paper's recipe, 195 HU mask) with a uniform skull loss of 6.65 to 26.6 dB/cm at 1 MHz, each scaled by its own free-field solve and the session's axial line; ln(simulated / measured) fitted as a line in the loss by transmitted power and by the spatial peak; its zero crossing is the loss asked for. Measured planes behind skulls B and C at 1 MHz. Data: Krokhmal, Simcock, Treeby & Martin 2025.
Source image · The full source image is fitted without cropping.
Source file identity
SHA-256 6e5e16a6b222189affa452db4e2ecd0fe6758e2a739ecc80fd3b35867512f022120,394 bytes
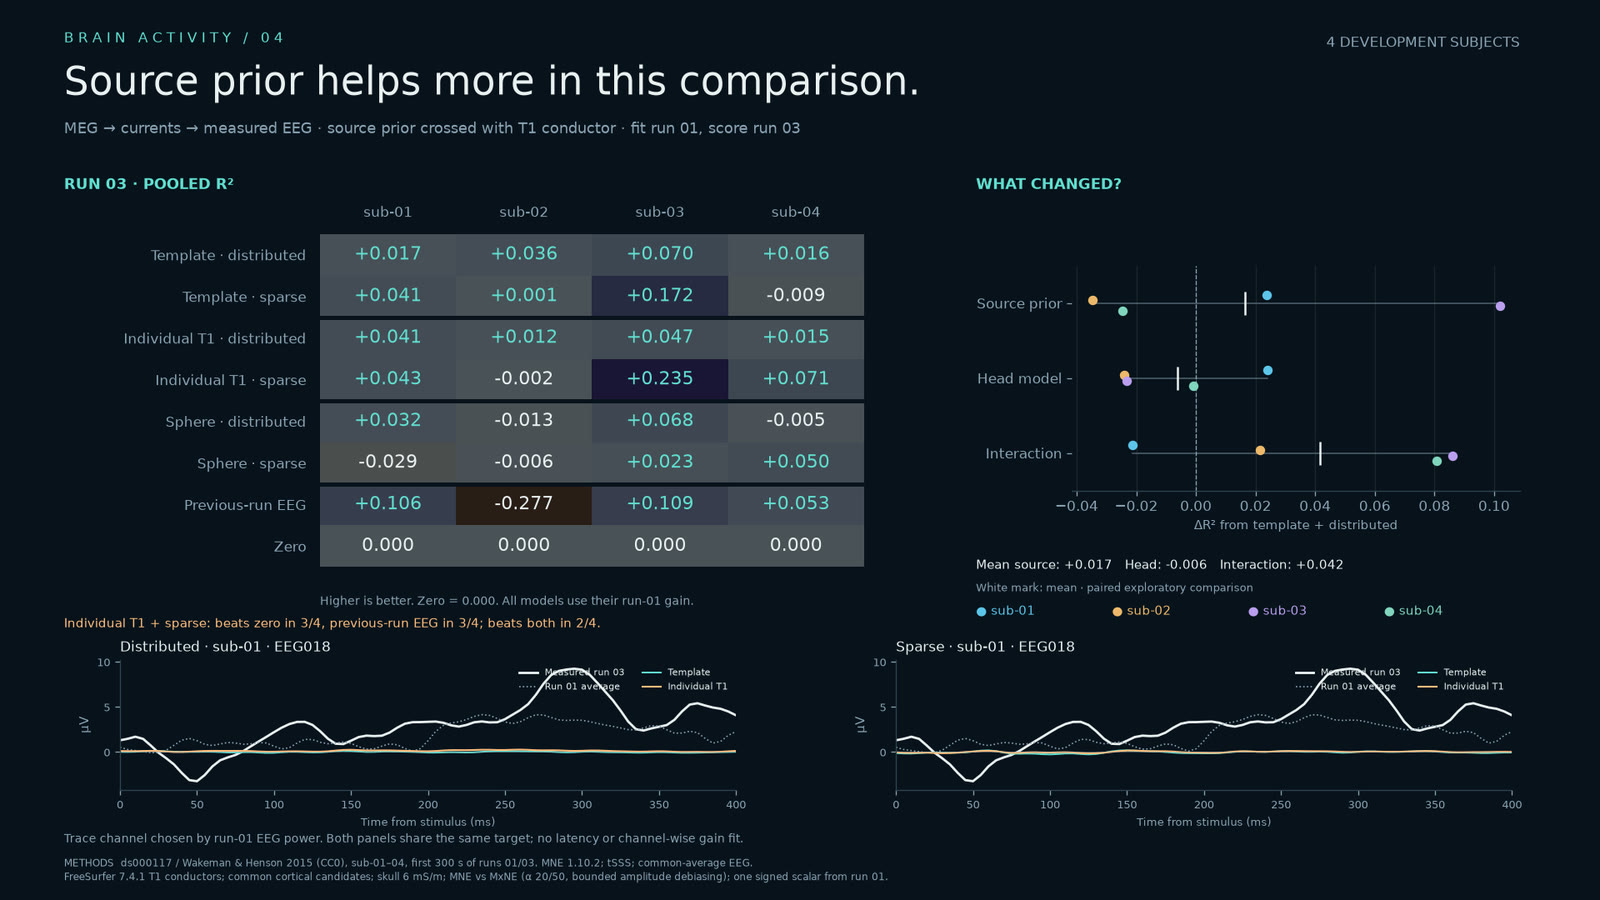
10 / 52.5–57.967 s · real data + simulated
Source prior helps more in this comparison
OpenNeuro ds000117 · Wakeman & Henson 2015 / MNE + MxNE · Brain Atlas
OpenNeuro ds000117 2.0.0 / Wakeman & Henson 2015 , sub-01–04, first 300 s of runs 01/03. MEG-only source fits with distributed MNE and sparse MxNE, crossed with template, individual T1 and sphere conductors. Gain and sparse alpha are chosen on run 01, then fixed for run 03 EEG scoring. Zero and previous-run EEG are baselines. Same candidate currents and fixed skull conductivity. Four explored subjects; aggregate plots only.
Source image · The full source image is fitted without cropping.
Source file identity
SHA-256 5a33bfb869ef722d8e8bf251546842de6efdbe0000278c17b2f6be8da396559f185,343 bytes
11 / 57.967–63.9 s · simulated
Following the wiring
TemplateFlow · MNI152 / McGill · TractoInferno / Poulin 2022 · Brain Atlas
Doesn't yet change patient forecasts: over three months on 74 LUMIERE patients, every fibre-following strength scores as isotropic growth does, to three decimals. Over 14 months it doubles the cells crossing the midline (45.9 against 22.5 mL). rd-fv7 reaction-diffusion on the MNI152 2009c template, fibres from TractoInferno (Poulin et al. 2022); strength K = 22.2 is a matched choice, not a fit. Rendered in our wgpu engine. Head silhouette: the TemplateFlow MNI152NLin2009cAsym template’s own T1w, source SHA-256 1f27aabea9f7183dc0c69dafa71e1787b921ca778d655d9c1bf302b273d5627a. In this simulation the tumour also grows into the brain's fluid spaces, which tumour models normally prevent.
Source film · Source playback 4.533–10.467 seconds.
Source file identity
SHA-256 2ce42cd610a661e662fd30da3a259741cad016d3dc674e2c441e3de531e100b03,534,838 bytes
12 / 63.9–70.367 s · simulated + illustrated
Protons stop where photons don’t
Mohan 2021 / BodyParts3D · © DBCLS / Z-Anatomy · Gauthier Kervyn
Same target coverage; the rest of the brain gets a third of the photon dose (mean 4.0 against 12.7 Gy). Two proton fields, constant RBE 1.1; as in a randomized trial (Mohan 2021). Head: BodyParts3D, © The Database Center for Life Science (DBCLS), built on the TARO model from one volunteer's MRI (Nagaoka et al. 2004); reworked by Z-Anatomy (Gauthier Kervyn). The face is cut away.
Source film · Source playback 7.033–13.5 seconds.
Source file identity
SHA-256 3a0201a263d3ff5a8a5ec8a6553e96e11de9bba61dde954f397c9212a7005c893,780,029 bytes