Brain Atlas / 2026-10-11 / Methods
The platform, today
87 seconds · 1920 × 1080 · 30 frames per second · silent
A silent daily edit of public platform pieces published on 11 October 2026. Every shot uses pinned, already published bytes. Excerpts retain the complete source frame and the producer’s annotations; film time and transitions are editorial. The underlying models are independent and are not coupled by this edit.
Labels distinguish real data, simulated outputs and illustrated appearance. Each section below records its model, limits, sources and public file identity. Lower-resolution sources are fitted proportionally into the 1920 × 1080 film, without cropping; all motion is resampled to 30 frames per second.
Breathing anatomy: BodyParts3D, © The Database Center for Life Science (DBCLS), CC BY-SA 2.1 Japan, built on the TARO model from one volunteer’s MRI (Nagaoka et al. 2004), reworked by Z-Anatomy (Gauthier Kervyn), CC BY-SA 4.0. Pulse 4.4.0: Kitware, Apache-2.0. This film is shared under the same licence, CC BY-SA 4.0.
The UCL calvaria still is credited to Krokhmal, Simcock, Treeby & Martin (2025), CC BY 4.0. Running data: Carter et al. (2024), CC BY 4.0, via AddBiomechanics (Werling et al. 2024). EEG recordings: Wakeman & Henson (2015), OpenNeuro ds000117 2.0.0, CC0. Arterial reference curves: Boileau et al. (2015), Figshare v1, CC0; openBF 2.8.0, Apache-2.0.
Protein folding uses PDB 1UAO (Honda et al. 2004), wwPDB CC0. Other molecular and genome credits appear with their shots. The full source Methods and limitations follow below.
The recurrence map is an already-public, smoothed cohort aggregate, credited to LUMIERE (Suter et al. 2022, Scientific Data 9:768, non-commercial) and MU-Glioma-Post (Yaseen et al. 2025, TCIA, doi:10.7937/7K9K-3C83, CC BY 4.0). It shows no individual patient image or shape. The template background is MNI152 2009c tissue.
Ribosome tomograms: CZ CryoET Data Portal 10442, CC0; picks, poses and statistics are derived. Displayed atoms are the fitted PDB 7P6Z model, not the measured syn3A density. The source’s wording correction and unresolved beam control accompany this edit.
Neuromuscular-junction source: MCell’s rat NMJ test suite, MIT licence, with MCell 4.2.0 reference runs. Enzyme kinetics follows Michaelis & Menten (1913), translated by Goody & Johnson (2011), with explicitly chosen teaching coefficients. No biological coupling between shots is claimed.
Population-template anatomy: TemplateFlow MNI152NLin2009cAsym (MNI ICBM2009c). McGill notice: Copyright (C) 1993–2004 Louis Collins, McConnell Brain Imaging Centre, Montreal Neurological Institute, McGill University. Permission to use, copy, modify, and distribute this software and its documentation for any purpose and without fee is hereby granted, provided that the above copyright notice appear in all copies.
01 / 0–8 s · simulated + illustrated
Breath by breath
Z-Anatomy · Gauthier Kervyn · CC BY-SA 4.0 / BodyParts3D · DBCLS · CC BY-SA 2.1 JP / Pulse · Kitware · Apache-2.0
BodyParts3D, © The Database Center for Life Science (DBCLS), CC BY-SA 2.1 Japan, built on the TARO model from one volunteer's MRI (Nagaoka et al. 2004); reworked by Z-Anatomy (Gauthier Kervyn), CC BY-SA 4.0. Z-Anatomy 0.1.7 breathing, illustrated, driven by total lung volume simulated in Pulse 4.4.0 (Kitware) for its standard adult male and female at rest, moderate and vigorous effort. This film is shared under the same licence, CC BY-SA 4.0. Pulse 4.4.0 is licensed Apache-2.0. The selected public rendition is 1920 × 1080; it is fitted without cropping.
Source film · Excerpt 40–48 s.
Source file identity
SHA-256 80194e740a78212c75750fb82d690df4b5a5eaaa483b0260d8cef4c9eac5e29b37,672,756 bytes
02 / 7.5–13 s · real data + simulated + illustrated
Force matching improves; the baseline still leads
Carter et al. 2024 · CC BY 4.0 / AddBiomechanics · Werling et al. 2024 / MyoSuite · MuJoCo · MuscleMimic
MyoFullBody (354 muscles) in MuJoCo 3.4; a learned controller fine-tuned from MuscleMimic mm-10m-2 on 12 Carter et al. 2024 runners (CC BY 4.0, via AddBiomechanics 1.0, Werling et al. 2024); P017 held out. ft8, ft9: 1,170 more updates, legs at 1.25x strength, ft9 rewarded for matching the plates' vertical force. Shape error: RMS of each stance's force over its own time and mean vs the plates'. Muscle activations simulated. Head not drawn. Across 11 held-out runs at two evaluation seeds, stance-shape error changes from 0.38 to 0.24, still 4.4 times the other runners’ average. The mid-stance rise does not hold at both seeds; P016’s pelvis bounces 20 mm more, and simulated knee loads run high. The generic bones are illustrated. The full published 1280 × 720 frame is fitted without cropping.
Source film · Excerpt 0.25–5.75 s.
Source file identity
SHA-256 c5e3fe287b9b782bd8535a2d1ab8597a31877dfcc5c91493ac5a17dcd2dd24d0982,335 bytes
03 / 12.5–17.5 s · simulated
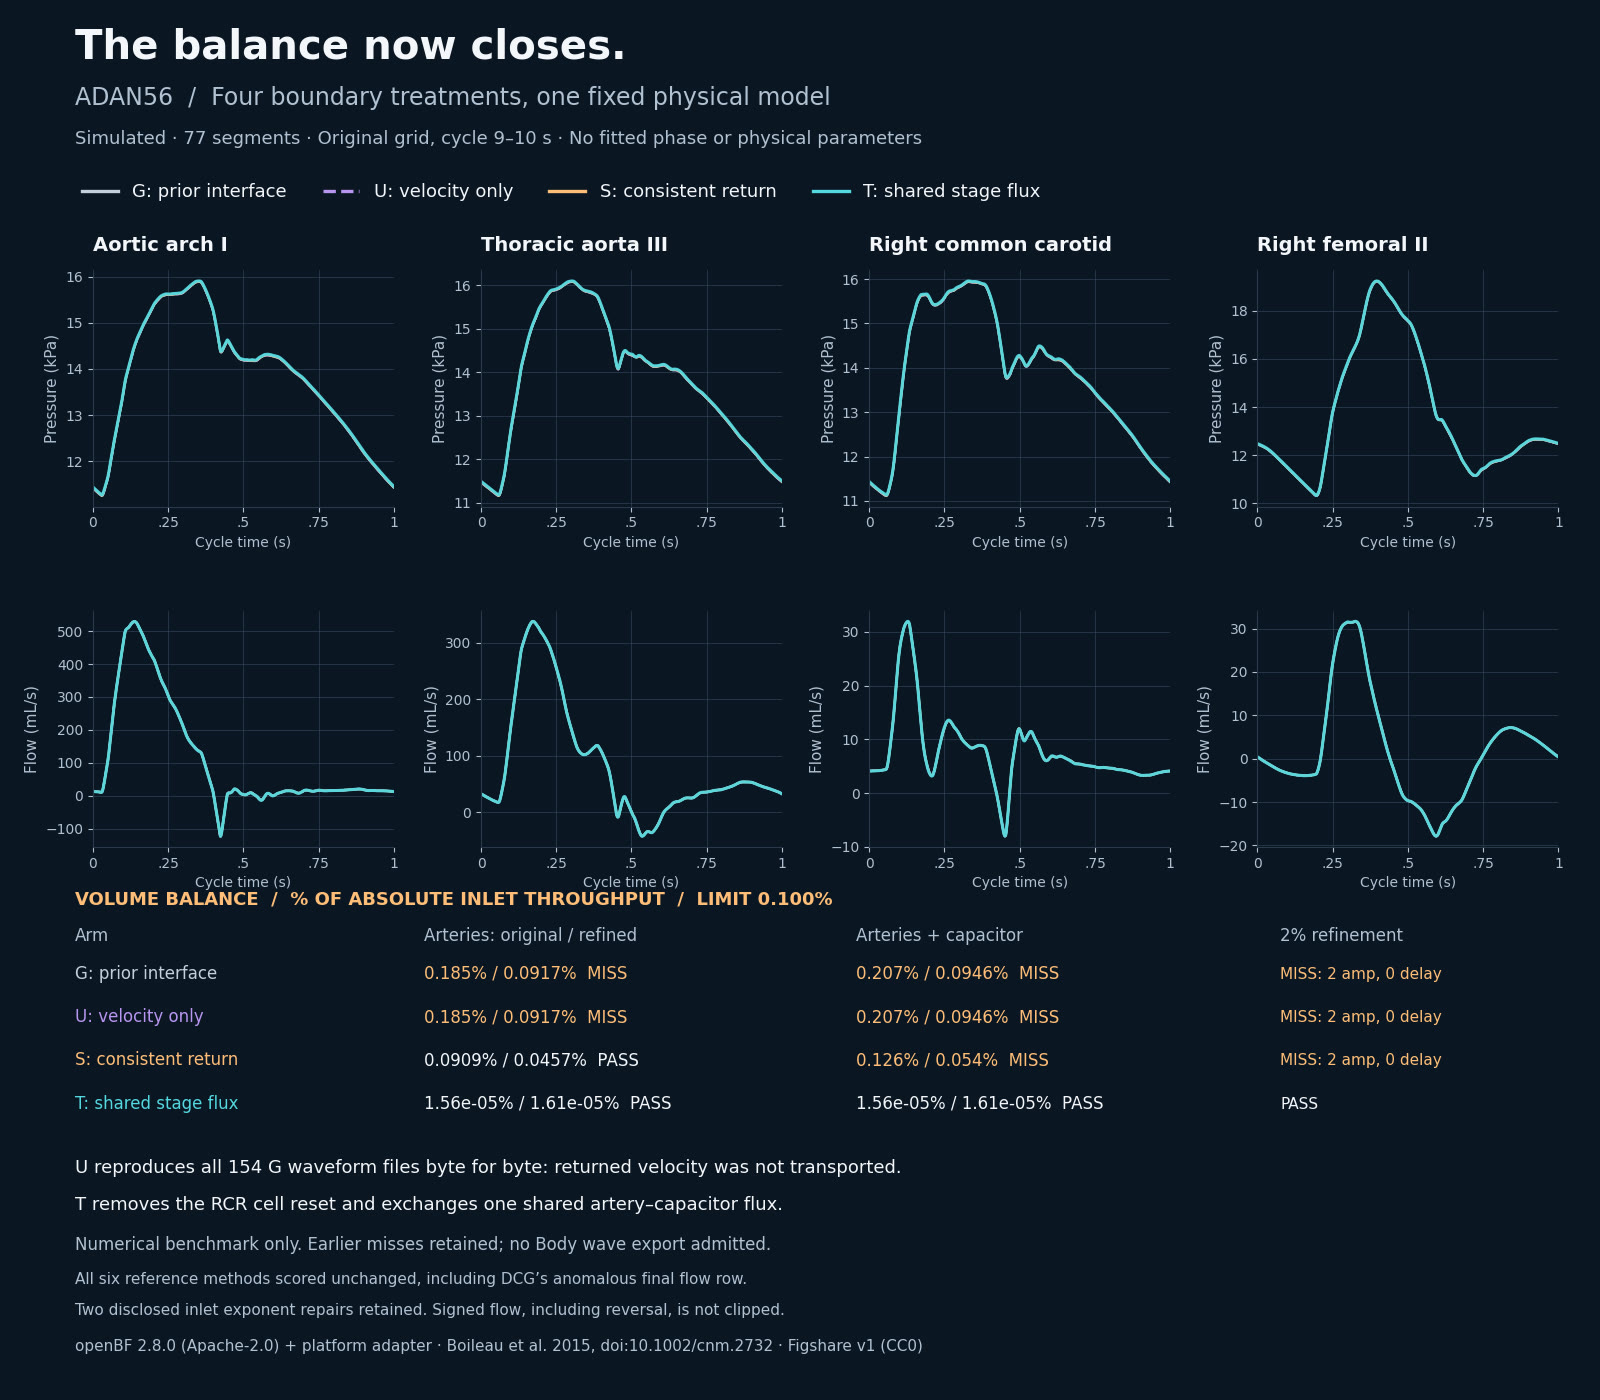
Arterial balance closes in a numerical benchmark
openBF 2.8.0 / Apache-2.0 · Boileau et al. 2015 / Figshare v1 / CC0 · Brain Atlas
openBF 2.8.0 (Apache-2.0) + platform boundary adapter; generic ADAN56, simulated. G/U/S/T share the same inlet, wall law and RCR parameters. Four mid-vessel sites, cycle 9–10 s; no fitted shift. Boileau et al. (2015), doi:10.1002/cnm.2732, six numerical methods from Figshare v1 (CC0). Two inlet exponent repairs and the DCG endpoint anomaly remain disclosed. No Body wave export is admitted. Numerical benchmark; no Body wave export is admitted. T passes the numerical gates shown. All earlier misses and the stopped harness attempt remain recorded. DCG’s last-row anomaly and the two disclosed inlet repairs are unchanged. The full published 1600 × 1400 frame is fitted without cropping.
Source image · The full source image is shown without cropping.
Source file identity
SHA-256 0d459b81e84e94938bcbad5aacea18f2cf75e397958e34aedaafb59b850265b9304,992 bytes
04 / 17–23 s · real data + simulated
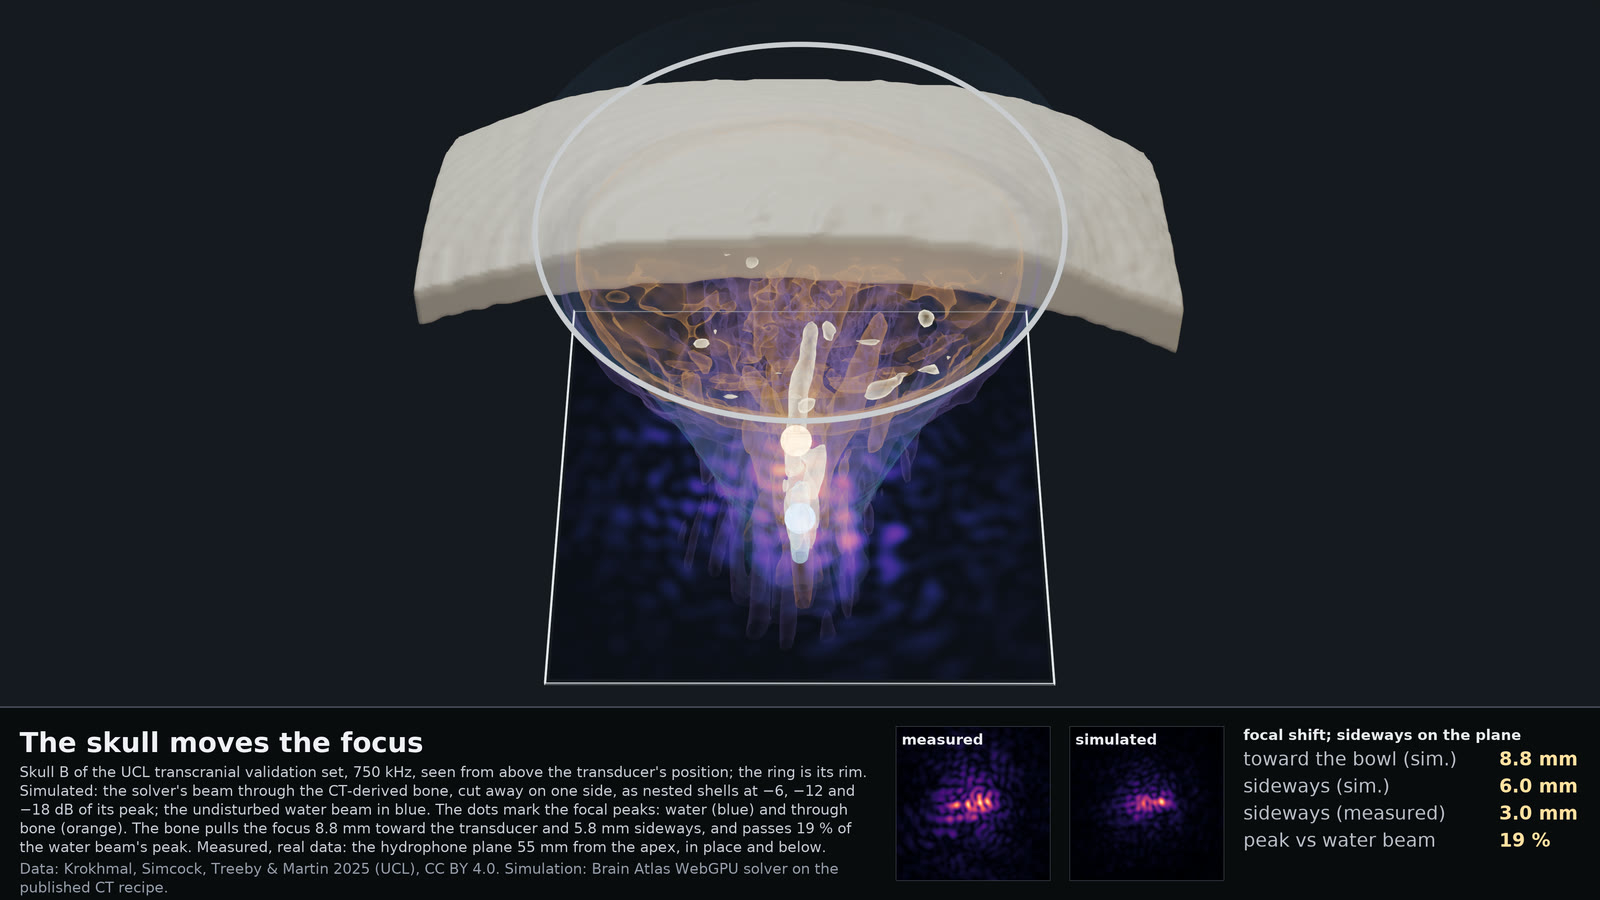
The skull moves the focus
UCL · Krokhmal, Simcock, Treeby & Martin 2025 · CC BY 4.0 / Brain Atlas
Our WebGPU solver on the UCL CT at 0.25 mm (the paper's recipe: Schneider density, c = 1.33ρ + 167, 13.3·f dB/cm; 195 HU mask), output over the whole beam, and the same solve in water; iso-amplitude shells by marching cubes; bone surface from the CT at 195 HU; focal peaks read from the two fields; Blender 5.2 Cycles. Measured plane from the UCL set, scaled by the session's axial line. Data: Krokhmal, Simcock, Treeby & Martin 2025, CC BY 4.0. On the measured hydrophone plane the lateral shift is 3.0 mm; the simulation gives 6.0 mm. This is the already published still, fitted whole without a new view or geometry render.
Source image · The full source image is shown without cropping.
Source file identity
SHA-256 fd0bc7dde94d30986d6e10808acee646174c05bc5590008d9e104d39f825d19f157,992 bytes
05 / 22.5–28.5 s · real data + simulated + illustrated
Fixed source locations are not enough
Wakeman & Henson 2015 · OpenNeuro ds000117 · CC0 / FreeSurfer fsaverage template
OpenNeuro ds000117 2.0.0 / Wakeman & Henson 2015 (CC0), sub-01–04, first 300 s of runs 01/03. Run-01 trial splits choose source support, ridge penalty and gain; run-03 MEG supplies currents. Template and sphere EEG predictions share a voltage scale with zero and previous-run baselines. Reused development runs; sub-02 whitening is unstable. FreeSurfer fsaverage average-template cortex; schematic maps. Inferred sources are nonunique. The fixed-support template beats both zero and the previous-run EEG in 1 of 4 subjects. Predictions remain weak. This is the earlier prediction iteration; the next shot tests repeatability of the measured target. The later rank repair does not make the prediction comparison a win.
Source film · Excerpt 8–14 s.
Source file identity
SHA-256 9d636fde7f49b5c7fe019076ec1d0761cb38ad09590d99ac5c1563c47016a0253,165,571 bytes
06 / 28–32.5 s · real data
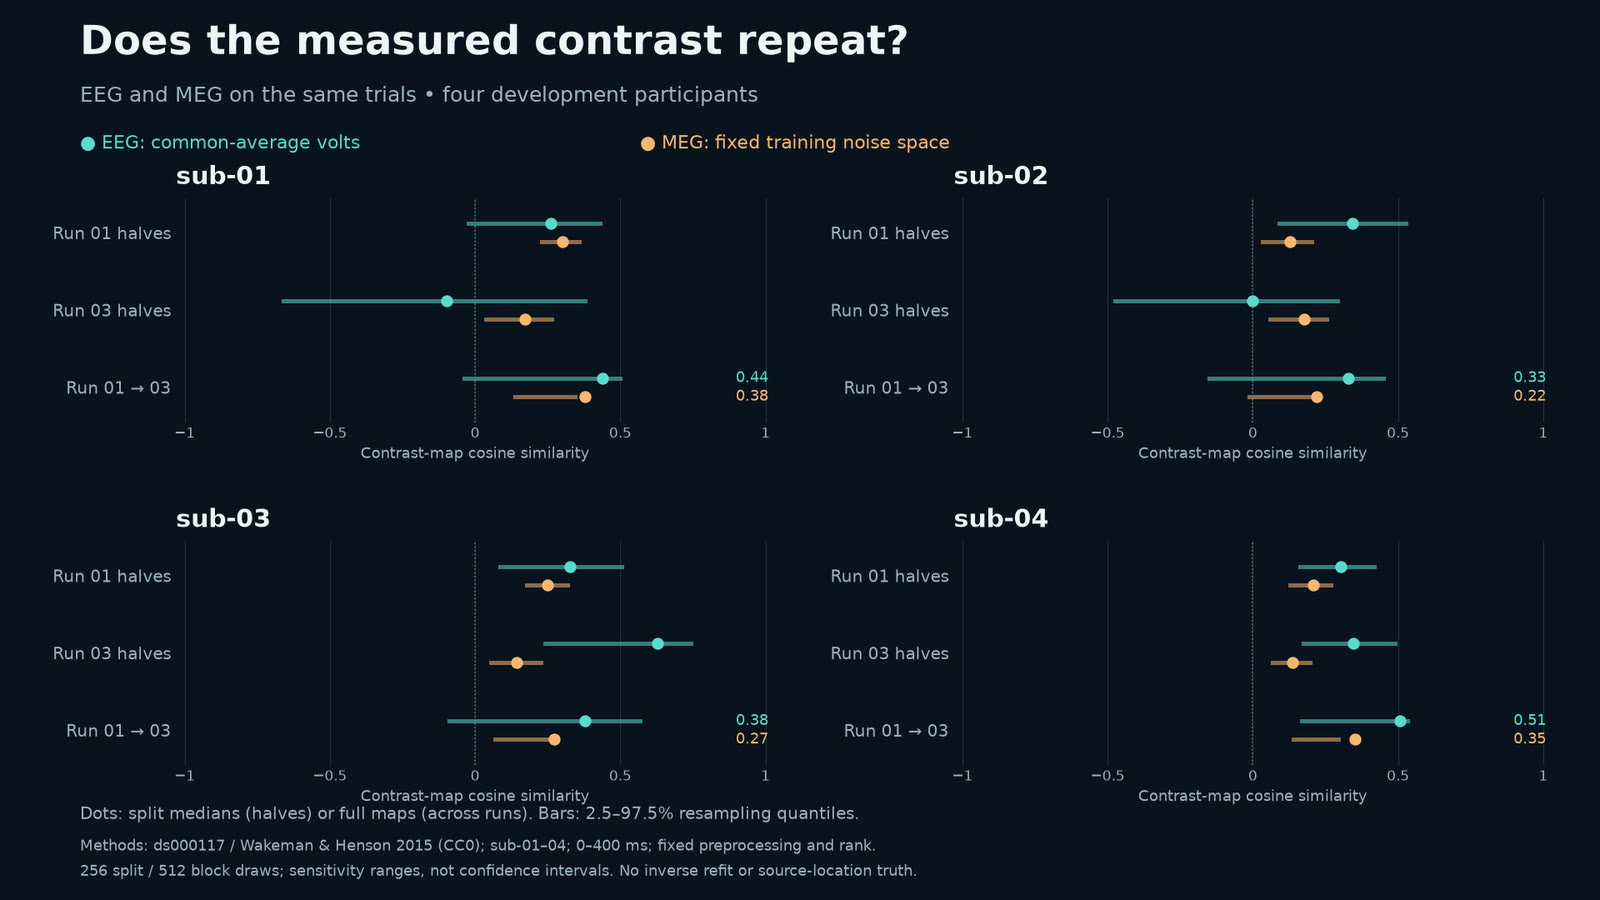
Does the measured contrast repeat?
OpenNeuro ds000117 2.0.0 · Wakeman & Henson 2015 · CC0 · Brain Atlas
OpenNeuro ds000117 2.0.0 / Wakeman & Henson 2015 (CC0), sub-01–04. Faces minus scrambled; first 300 s of runs 01/03; 0–400 ms. Common-average EEG; MEG in fixed run-01 noise space. Dots: split medians or full maps. Bars: 2.5–97.5% ranges from 256 splits or 512 ten-trial block draws. Exploratory sensitivity; preprocessing fixed. Aggregate plot only. Exploratory repeatability diagnostic across four development participants, not a new model win. Run-03 EEG split medians range from −0.10 to 0.63; MEG agreement is modest. These resampling ranges are sensitivity ranges, not confidence intervals. Earlier prediction scores remain unchanged. The full published 1600 × 900 frame is fitted without cropping.
Source image · The full source image is shown without cropping.
Source file identity
SHA-256 f98b976c35ac802d48148bf3321b24e649557e609f46930cc0b603794b57f044135,571 bytes
07 / 32–40 s · simulated + illustrated
A tumour grows its own blood supply
Anderson & Chaplain 1998 · Gerhardt 2003 · Swanson 2000 / Brain Atlas
A hybrid sprouting-angiogenesis model on the Super Lab core. Hypoxic tumour cells release VEGF (Shweiki 1992; Jiang 1996) that diffuses and clears (Mac Gabhann 2006; Serini 2003); tip cells sprout, climb the gradient, branch and fuse (Anderson & Chaplain 1998; Gerhardt 2003; Stokes 1991); maturing vessels feed a proliferation–invasion tumour (Swanson 2000; Ghaffarizadeh 2016, 2018). Synthetic geometry only; drawn cells and vessels illustrated. One run per condition from the same synthetic start; the comparison is a demonstration, not a replicated effect estimate. The full published 1280 × 720 source is retained.
Source film · Excerpt 12–20 s.
Source file identity
SHA-256 02969af49a16a3848b3fe2e0a0cc91da03c53ae255183dccb213eecc84e2c3905,158,989 bytes
08 / 39.5–45 s · real data + simulated
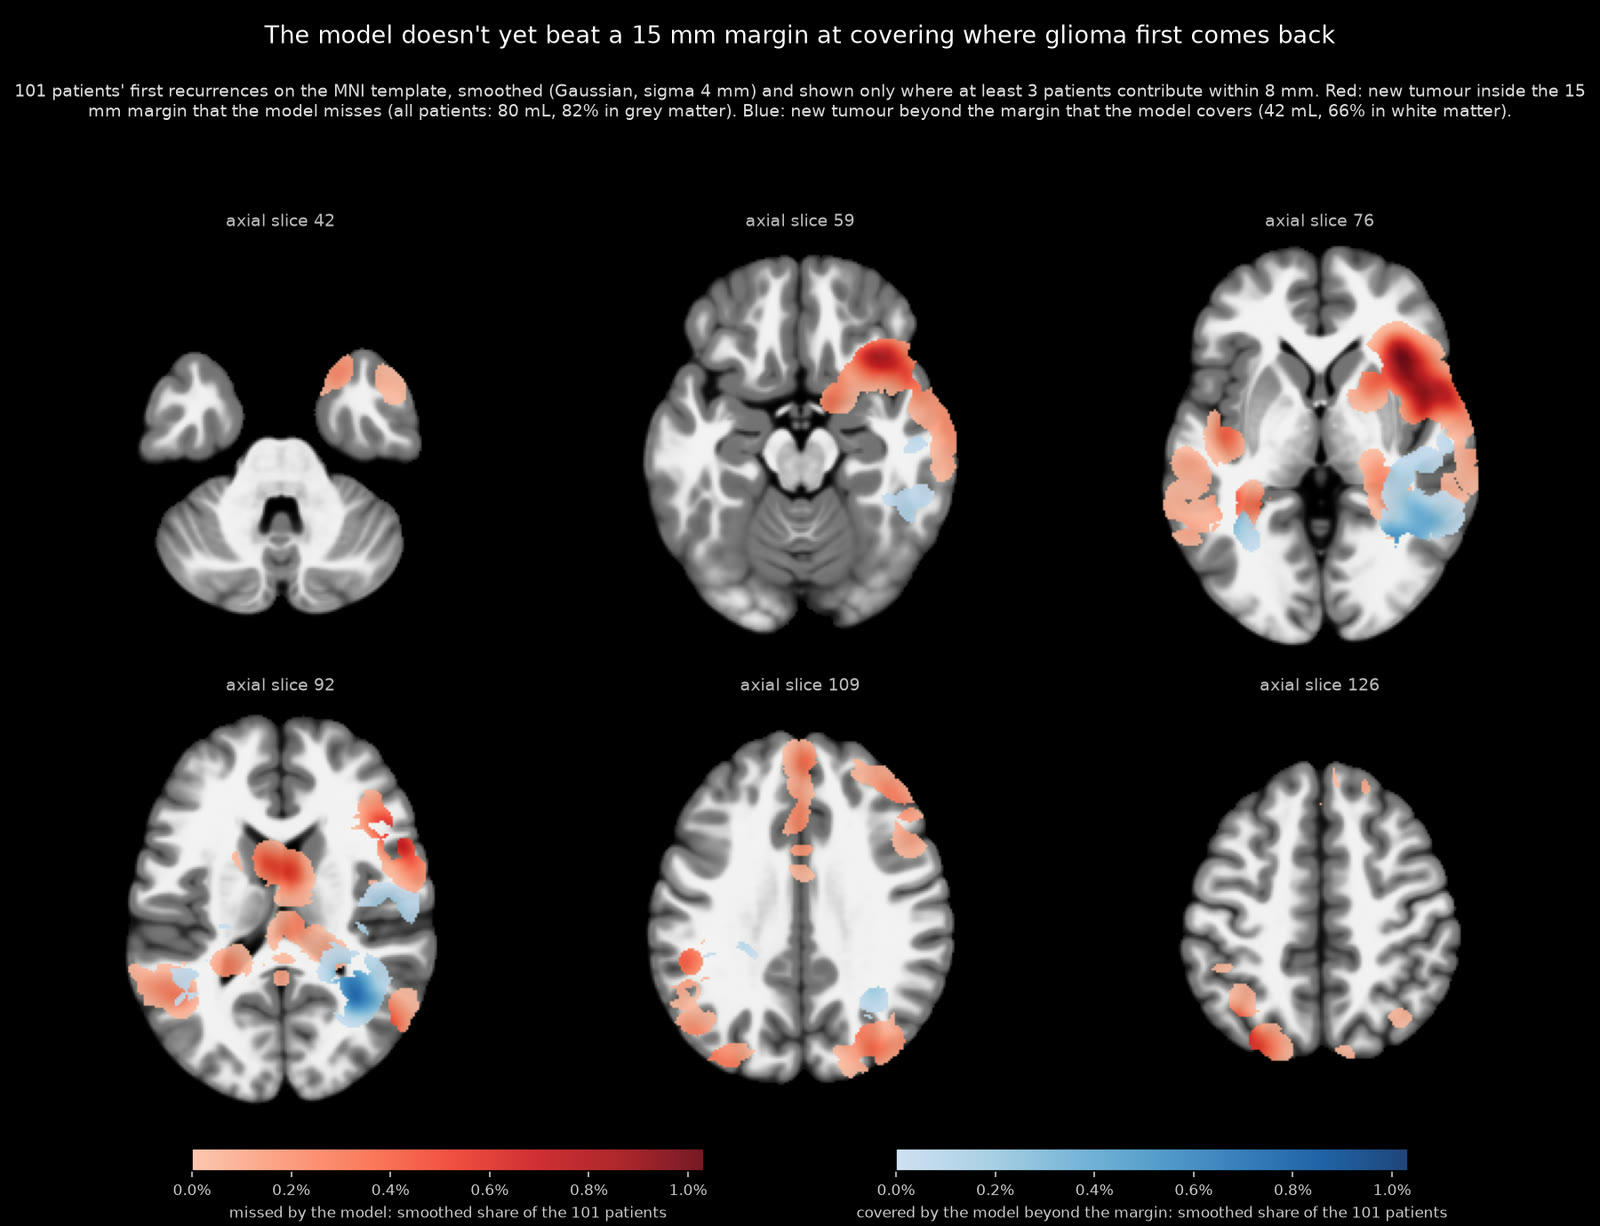
The growth model still trails a 15 mm margin
LUMIERE · Suter et al. 2022 · non-commercial; MU-Glioma-Post · Yaseen et al. 2025 · TCIA · CC BY 4.0; MNI152 2009c template / MNI152 · McGill
Doesn't yet beat a 15 mm margin. M13, the fit-loop growth model (reaction-diffusion from post-op scans), vs that margin at equal volume: new enhancing tumour at first recurrence that one covers and the other misses, in 101 patients on the MNI152 2009c template; smoothed, shown only where ≥ 3 patients contribute. LUMIERE, Suter et al. 2022, Sci Data 9:768, non-commercial; MU-Glioma-Post, Yaseen et al. 2025, TCIA, doi:10.7937/7K9K-3C83, CC BY 4.0. Only the already-public cohort aggregate is shown: Gaussian smoothing σ 4 mm and at least three distinct patients contributing within 8 mm. No individual patient image or shape is displayed. Across all patients, the margin covers 80 mL that the model misses (82% grey matter); the model covers 42 mL beyond the margin (66% white matter). This is a different model from the preceding synthetic angiogenesis demonstration. The full published 1600 × 1226 frame is fitted without cropping.
Source image · The full source image is shown without cropping.
Source file identity
SHA-256 369835c13880f7f2c7eae988c809086a3d36684ef8fff1863b98ad91d0ca8716186,837 bytes
09 / 44.5–51.5 s · simulated
Nine trials. One junction. Different outcomes.
MCell rat NMJ test suite · MIT licence · MCell 4.2.0 · Brain Atlas WebGPU
MCell's rat neuromuscular junction model (MCell test suite, MIT licence), run live by Brain Atlas's WebGPU kernel in the public app at the model's own setting. Per-run peaks against MCell 4.2.0's 500 runs: SD 17.0 against 17.3; 3 of 9 outside MCell's 10th–90th range, about 1.7 expected; mean 2.4 % below, inside the stated ±5 %. 2,000 new runs each, MCell and the same kernel on native Metal: SD ratio 0.997 (95 % CI 0.95–1.04), mean 0.26 % above. The comparison band shown in this excerpt is 500 simulated MCell reference runs, not measured biological variability. The 2,000-run result is a separate comparison between MCell and the same kernel on native Metal; this excerpt shows nine public-app trials. Simulation trials each span 5 ms; movie time is presentation time. The full published 1920 × 1080 frame is fitted without cropping. Wording corrected 11 October 2026: the spread comparison uses 2,000-run arms.
Source film · Excerpt 40–47 s.
Source file identity
SHA-256 ec2661277a00b82ac9aff94ee1fdc162556e4296808bcbc00bc0c5ad13eac27930,089,925 bytes
10 / 51–59 s · real data + simulated + illustrated
From the sarcomere to one myosin head
EMD-14000 · Wang & Raunser / FiberSim 2.3.2 · Campbell · CC BY 4.0 / PDB 8G4L, 6KN8, 7QIN · wwPDB
From a cryo-electron tomogram of a mouse cardiac A-band (EMD-14000, Wang & Raunser; 1337 × 951 × 136 nm) in along the filaments to one myosin head; the modelled lattice comes in molecule by molecule 320–170 nm from it. Head states and sites at t = 0.501 s of FiberSim v2.3.2's k_tr demo (pCa 4.5, seed 1) simulated; PDB 8G4L, 6KN8, 7QIN. Detached-head poses, stroke, S2, cut-away and the reveal illustrated; camera, light, haze artist-made. This is a camera move and illustrated reveal at fixed model time, not a new contraction trajectory. Molecular models: Dutta et al. 2023 (8G4L), Yamada et al. 2020 (6KN8), Wang et al. 2022 (7QIN). FiberSim 2.3.2: Campbell Muscle Lab, doi:10.5281/zenodo.12631182, CC BY 4.0. The source card is dated 12 October; these exact bytes were published on 11 October at 12:01:09 UTC. The full published 1920 × 1080 frame is fitted without cropping.
Source film · Excerpt 0–8 s.
Source file identity
SHA-256 68f3d04e9f15a596f29a73b7f60f3389b23f989d45c0c91f5e12b7e56cb3d4256,803,650 bytes
11 / 58.5–65.5 s · simulated + illustrated
Enzyme saturation: pulses and a faster rate
Michaelis & Menten 1913 · Goody & Johnson 2011 translation · Brain Atlas
Michaelis–Menten kinetics with chosen teaching coefficients, simulated concentrations/rates; molecular choreography and energy schematic illustrated. 32 model seconds at 24 film frames/s, alternating two and three fixed 1/60 s steps. No interpolated concentrations. Source GPU input 1149×696 is fitted with centered padding into 1600×1000. The kinetic coefficients are chosen for teaching and are not experimentally calibrated. Sucrose pulses occur at movie seconds 5 and 12; the rate doubles at 22 seconds, within this excerpt. Molecular choreography is not molecular dynamics, and the energy scale is arbitrary. The full published 1600 × 1000 frame is fitted without cropping.
Source film · Excerpt 19–26 s.
Source file identity
SHA-256 a9eabfa00c01f95032351ce4aec13c6e5b5eba53f7a23868a376bdc7fe5e840d10,056,187 bytes
12 / 65–71 s · real data
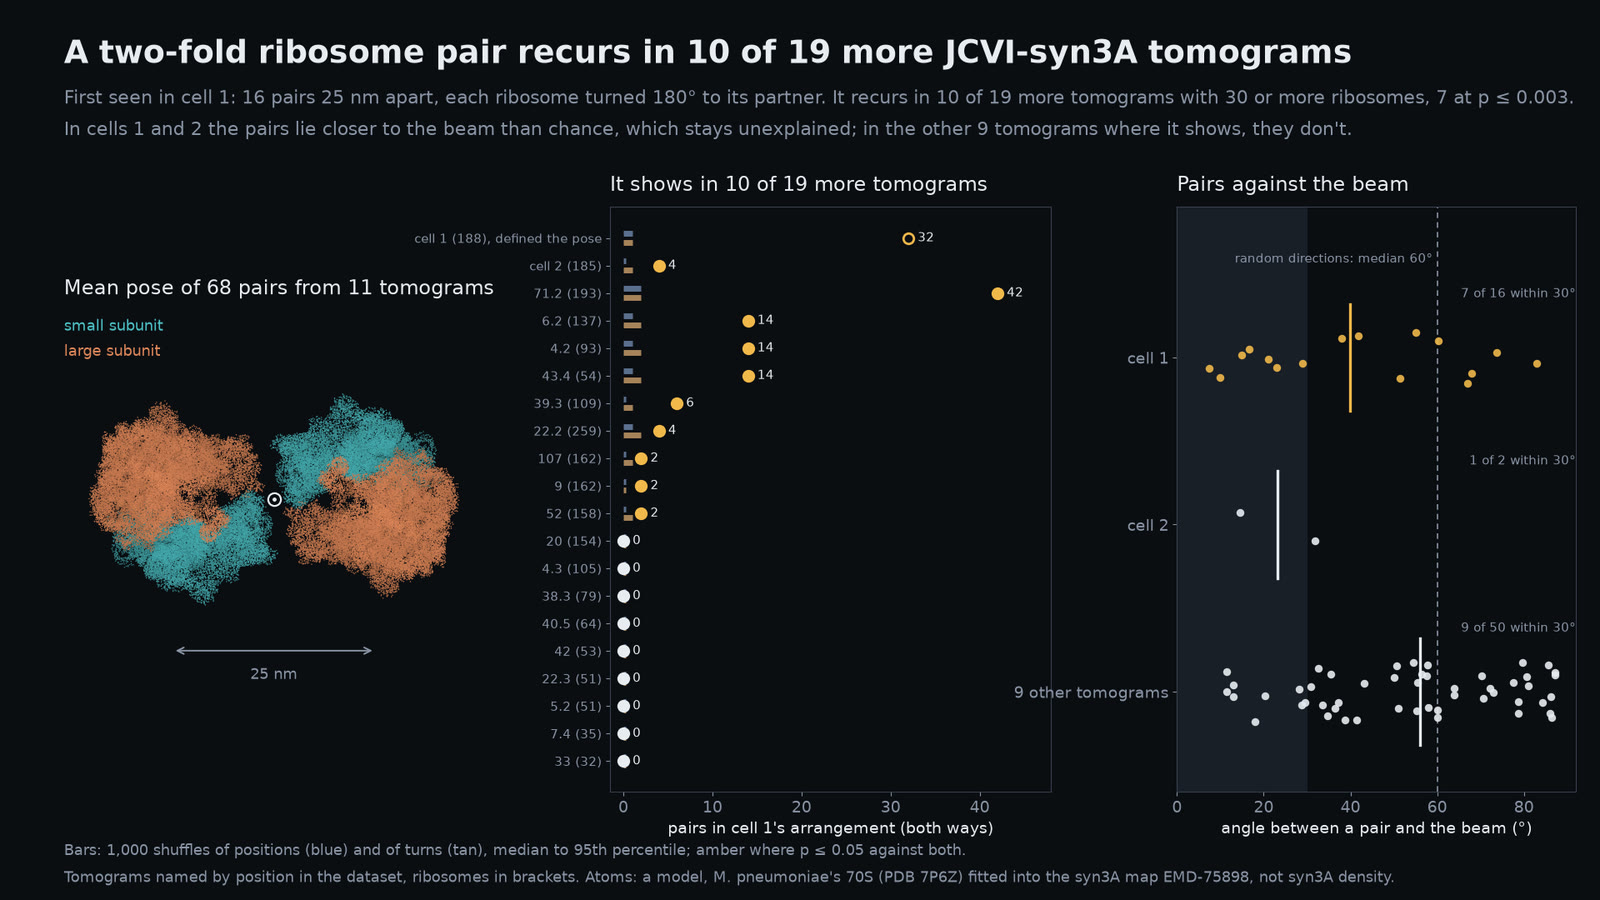
Some ribosomes pair: a pattern in 10 of 19 more tomograms
CZ CryoET 10442 · CC0 · EMD-75898 · PDB 7P6Z fitted model · Brain Atlas
CZ CryoET 10442 tomograms (CC0); ribosomes matched (pytom-match-pick 0.14.0, EMD-75898), refined. Pairs 20–35 nm apart within 30° of cell 1's pose vs 1,000 position and turn shuffles: p ≤ 0.05 in 10 of 19 further tomograms, 7 at p ≤ 0.003; a beam-angle control flags cells 1 and 2 only. Simulated lone ribosomes give none; partner averages show no duplicate. Not Brandt 2009's or Xue 2022's polysome pairs. Atoms: PDB 7P6Z, a fitted model, not syn3A density. Wording corrected 2026-10-11: counts are per tomogram. This is a development finding, not held-out confirmation. The discovery tomogram is excluded from the 10-of-19 recurrence count. Nine of the 20 counted tomograms contain picks in more than one separate masked region, which can represent more than one cell; the count is not a count of individual cells. The beam-alignment flags remain unexplained. The atoms are M. pneumoniae PDB 7P6Z fitted into EMD-75898, not syn3A density; this pair is distinct from the separately studied published t-t configuration. A confirmatory held-out test remains future. The full published 1600 × 900 frame is fitted without cropping.
Source image · The full source image is shown without cropping.
Source file identity
SHA-256 6e7eb5b1e0b5ebfc70aaa580778e1ed4253e5e197e271f4bd8f64cad227f1689199,793 bytes
13 / 70.5–77.5 s · real data + simulated + illustrated
Where the fold differs
PDB 1UAO · Honda et al. 2004 · wwPDB CC0 / Clementi 2000 / Horn 1987
Target-conditioned Cα Gō dynamics from the deposited first PDB 1UAO NMR conformer. Every ordered Cα residue is fitted with equal weight using proper rotation and translation (Horn, 1987); no scaling, reflection or omitted residues. Fits and colours use completed simulated observations. Frame and reduced model time are recorded separately from film time; no calibrated physical folding rate is inferred. No coordinate interpolation. Appearance, camera and presentation time are illustrated. Source: PDB 1UAO model 1, ten C-alpha residues, Honda et al. (2004), wwPDB CC0. Native-centric model: Clementi, Nymeyer & Onuchic (2000). The excerpt lies within the advancing segment; film seconds are presentation time, not a physical folding rate.
Source film · Excerpt 8–15 s.
Source file identity
SHA-256 bbf8d7768219ffe63ff283f57615240b517a33611a04be2dc692f8ff3e7debd71,958,541 bytes
14 / 77–87 s · real data + illustrated
From chromatin to one base pair
Tan et al. 2018 · Dip-C / UCSC hg38 / PDB 1KX5, 1ZBB / GRCh38 · ClinVar 14087
Render from a cell nucleus to one base pair. Nucleus: Dip-C model of how one GM12878 cell's chromosomes fold (Tan et al. 2018), fitted to its measured DNA contacts; chr14 bands: UCSC hg38. Nucleosomes: PDB 1KX5 on 1ZBB's zigzag (arrangement illustrated). Helix: the reference genome's letters (GRCh38) around chr14:23,429,278 on an illustrated B-DNA (Arnott 1972); ClinVar 14087 catalogues a C>T change there (MYH7 p.Arg403Gln). Bonds illustrated.
Source film · Excerpt 36–46 s.
Source file identity
SHA-256 04066fd3725e3e7fa7bad57c08e006628079d4aef52757d88fa956b23994350737,893,848 bytes