Brain Atlas / 2026-10-13 / Methods
The platform, today
81.5 seconds · 1920 × 1080 · 30 frames per second · silent
A silent compilation of eleven published platform films and figures. Each source frame is fitted without cropping, with its own label and credit. Half-second dissolves join the scenes.
The scenes come from independent studies with different clocks, data and baselines. Their calculations are not connected into one biological simulation. Measured structures, simulated dynamics and illustrated camera work keep their separate labels.
The model trained on more runners misses its learning check. Both ultrasound solvers still miss the published field, and the cause remains open. Chromosome partitioning is incomplete; the stricter ribosome-pair count is retained below. Playback seconds are not model time.
01 / 0–8 s · simulated + illustrated
Inside the heart
Heart geometry · Browne; Browne & Schlehlein / HRA–HuBMAP / Ursino heartbeat model
A camera tour of the HRA/HuBMAP heart geometry by Browne and Browne & Schlehlein. The film includes a recorded Ursino-based simulated heartbeat at ten-times slow motion; this excerpt retains its own annotations. Geometry, lighting and camera are illustrated. The following molecular and cell scenes are separate models, not coupled to this heart.
Source film · Excerpt 1–9 s.
Source file identity
SHA-256 1a77820c5a68ff57887a660f3e19d16acf69a69735f257eb977cdb61d5c6974e8,438,147 bytes
02 / 7.5–16.5 s · real data + simulated + illustrated
From the sarcomere to one myosin head
EMD-14000 · Wang & Raunser / FiberSim 2.3.2 / PDB 8G4L, 6KN8, 7QIN
From a cryo-electron tomogram of a mouse cardiac A-band (EMD-14000, Wang & Raunser; 1337 × 951 × 136 nm) in along the filaments to one myosin head; the modelled lattice comes in molecule by molecule 320–170 nm from it. Head states and sites at t = 0.501 s of FiberSim v2.3.2's k_tr demo (pCa 4.5, seed 1) simulated; PDB 8G4L, 6KN8, 7QIN. Detached-head poses, stroke, S2, cut-away and the reveal illustrated; camera, light, haze artist-made.
Source film · Excerpt 1–10 s.
Source file identity
SHA-256 1487101759a4065967c94c2cb7e10dcab5b2d6f3bfefe4b8713c248f041bcff09,899,746 bytes
03 / 16–25 s · real data + simulated + illustrated
From one myosin head to its atoms
PDB 8EFH, 8G4L, 6KN8 / FiberSim 2.3.2 / Brain Atlas 2026
From the still's camera into its featured myosin head, surfaces dissolving into deposited atoms (van der Waals spheres), to the actin–myosin interface. Its motor domain and gripped actin: PDB 8EFH (human β-cardiac myosin on pig cardiac actin, ADP-bound, 3.3 Å), fit to the drawn actin at 1.2 Å; other surfaces their own sources (8G4L, 6KN8). Head states at 0.501 s of FiberSim's k_tr demo simulated; dissolve illustrated; camera, light artist-made.
Source film · Excerpt 1–10 s.
Source file identity
SHA-256 331b042a82a670389fdb86ac9082e0702a38fb3c6d8a96513565387768b3584810,041,521 bytes
04 / 24.5–32.5 s · simulated + illustrated
Following one acetylcholine
MCell rat neuromuscular-junction model / Brain Atlas recorded run, 2026
MCell's rat neuromuscular-junction model, run at its own settings by the Brain Atlas WebGPU kernel on native Metal. The run records all 6,200 acetylcholines every microsecond for five milliseconds. One recorded molecule was chosen because it binds a receptor and is then split. This excerpt follows the start of that selected trajectory, not its complete outcome or a typical molecule. Camera, appearance and docked poses are illustrated.
Source film · Excerpt 1–9 s.
Source file identity
SHA-256 e300787524e7fd60a31963c736288874547ecd3a1c7b9efcc153b452cd6e5dd933,260,516 bytes
05 / 32–39 s · simulated + illustrated
Two chromosomes begin to part
4D whole-cell model · Thornburg et al., Cell 2026 / btree_chromo / polymer-bd 0.4.1
The chromosome model polymer-bd 0.4.1, a WebGPU port of btree_chromo, starts from the state reached at 3,924 simulated seconds in cell 35. Over 75 four-second windows to 4,224 s, directives come from the 4D whole-cell model’s own writer (Thornburg et al., Cell 2026), driven by its published cell-35 membrane calls and counts. The neck deepens and the two daughter chromosomes collect toward opposite lobes. Beads per lobe and partitioning are read by the model’s own check: partitioning is not complete. Colours by daughter and the camera are illustrated. The video’s playback time is not the model’s clock; this excerpt keeps its source annotations.
Source film · Excerpt 11–18 s.
Source file identity
SHA-256 8d1ac9c2a0aca7c452fd479c227f74ba85eb55515b4e2b5f1ef5f1c5a209973015,403,146 bytes
06 / 38.5–46.5 s · real data + illustrated
Ribosome pairs in their own tomogram
JCVI-syn3A · CZ CryoET Data Portal 10442 / EMD-75898 / PDB 7P6Z
One cryo-electron tomogram of JCVI-syn3A, from CZ CryoET Data Portal dataset 10442, mirrored for display to match the ribosome map's hand. Template matching with pytom-match-pick 0.14.0 and EMD-75898 followed by refinement gives 21 pairs among 193 ribosomes in this tomogram. Pairs are 20–35 nm apart and within 30 degrees of the first tomogram's pair pose. The atoms are PDB 7P6Z, a Mycoplasma pneumoniae model fitted into EMD-75898, not syn3A density. Camera, fades and colours are illustrated. The source first reported recurrence in 10 of 19 additional tomograms. Two of those ten fail a stricter refinement check registered afterwards; under that check the count is 8 of 14 additional tomograms. The featured tomogram passes. These are tomogram counts, not independent cell counts.
Source film · Excerpt 4–12 s.
Source file identity
SHA-256 d331af909fe105b495940fd6438f5a1b99707f75ed41768f80ce7301394aa51412,096,306 bytes
07 / 46–54 s · simulated
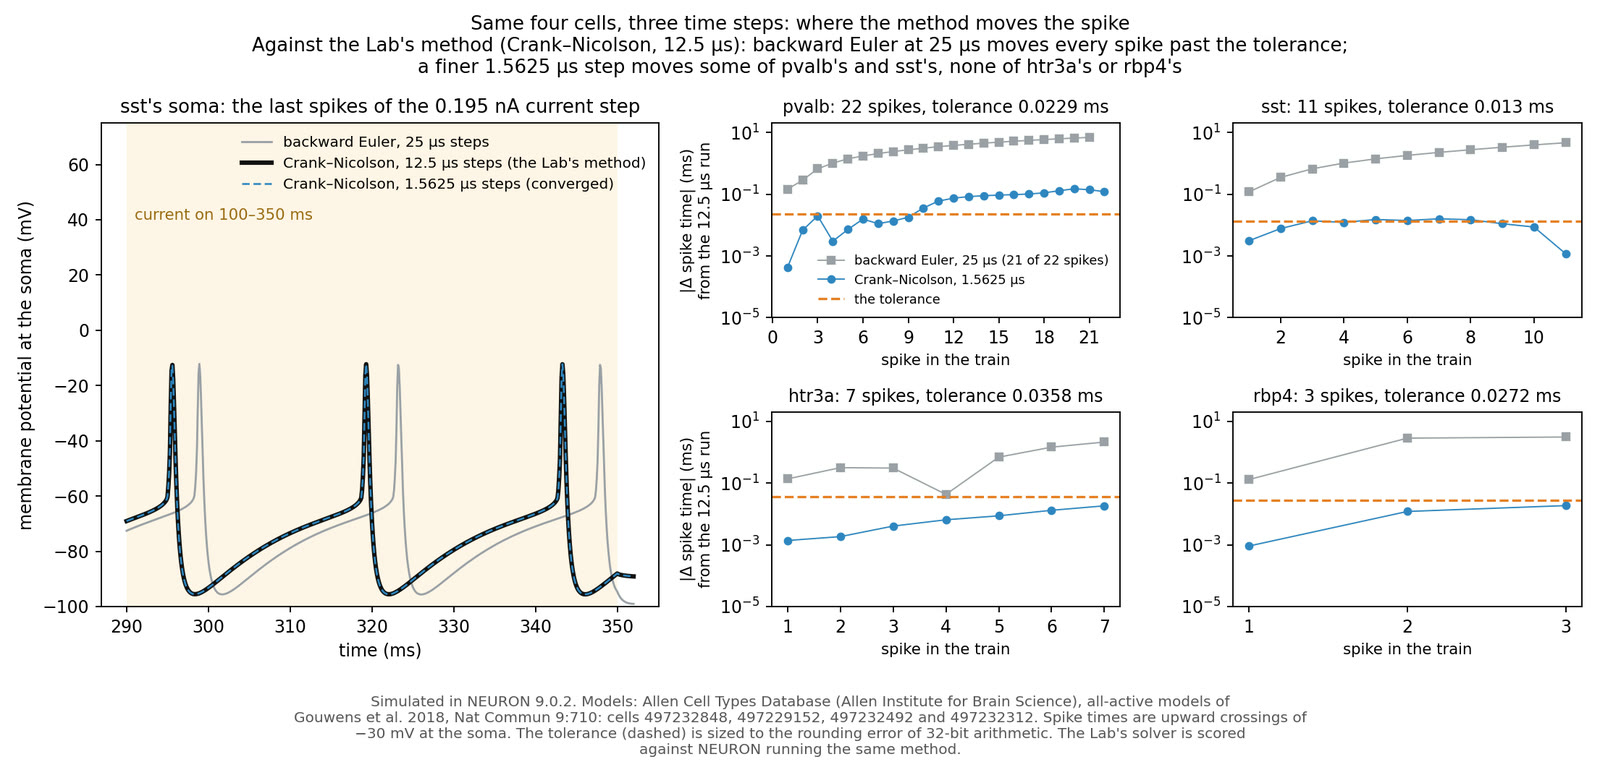
The method and time step move the spike
Allen Cell Types Database · Gouwens et al. 2018 / NEURON 9.0.2
Four model neurons from the Allen Cell Types Database (Gouwens et al. 2018), simulated in NEURON 9.0.2 under a 250 ms current step at 1.5 times each cell's firing threshold. The figure compares backward Euler at 25 microseconds with Crank–Nicolson at 12.5 and 1.5625 microseconds. The comparison's reference is the 12.5-microsecond method; changing the method or step moves spike times. Its tolerance is sized to 32-bit rounding error. Matching the reference method is a different question from convergence toward a smaller time step.
Source image · The full source image is shown without cropping.
Source file identity
SHA-256 95521dbb765abdd3776f6ebb38399d202aac62e87ac2b9c09543faa0eb6857b1215,306 bytes
08 / 53.5–61.5 s · real data + simulated + illustrated
Recovering an MRI image from five eighths of its sampling lines
IXI dataset · subject 165 / KomaMRI 0.13.2 / FastSurfer · Henschel et al. 2020
KomaMRI 0.13.2 full-Bloch MPRAGE on IXI subject 165’s FastSurfer brain labels, 144 × 192 × 144 at 1 mm. The middle partition’s magnitude image is given a modelled smooth phase (linear plus quadratic, −1.5 to +1.6 radians), because the simulation has no field map. Keeping 120 of 192 phase-encode sampling lines gives a modelled scan time of 188 rather than 300 s, with an estimated signal-to-noise ratio 0.79 times the full acquisition’s. Zero filling, conjugate filling and homodyne are exact arithmetic on this k-space. Conjugate filling assumes a real image; homodyne estimates phase from the central band and takes the real part. Real scan phase has more structure, so the recovery shown is an idealisation. The film shows only brain images, with no facial surface; source anatomy is measured, acquisition and phase are simulated, and diagrams are illustrated.
Source film · Excerpt 22–30 s.
Source file identity
SHA-256 950e60df8709a806f4f7c9da2c0f4d28fc63c7ddf7062e13aae3d124f996085e8,881,666 bytes
09 / 61–69 s · simulated
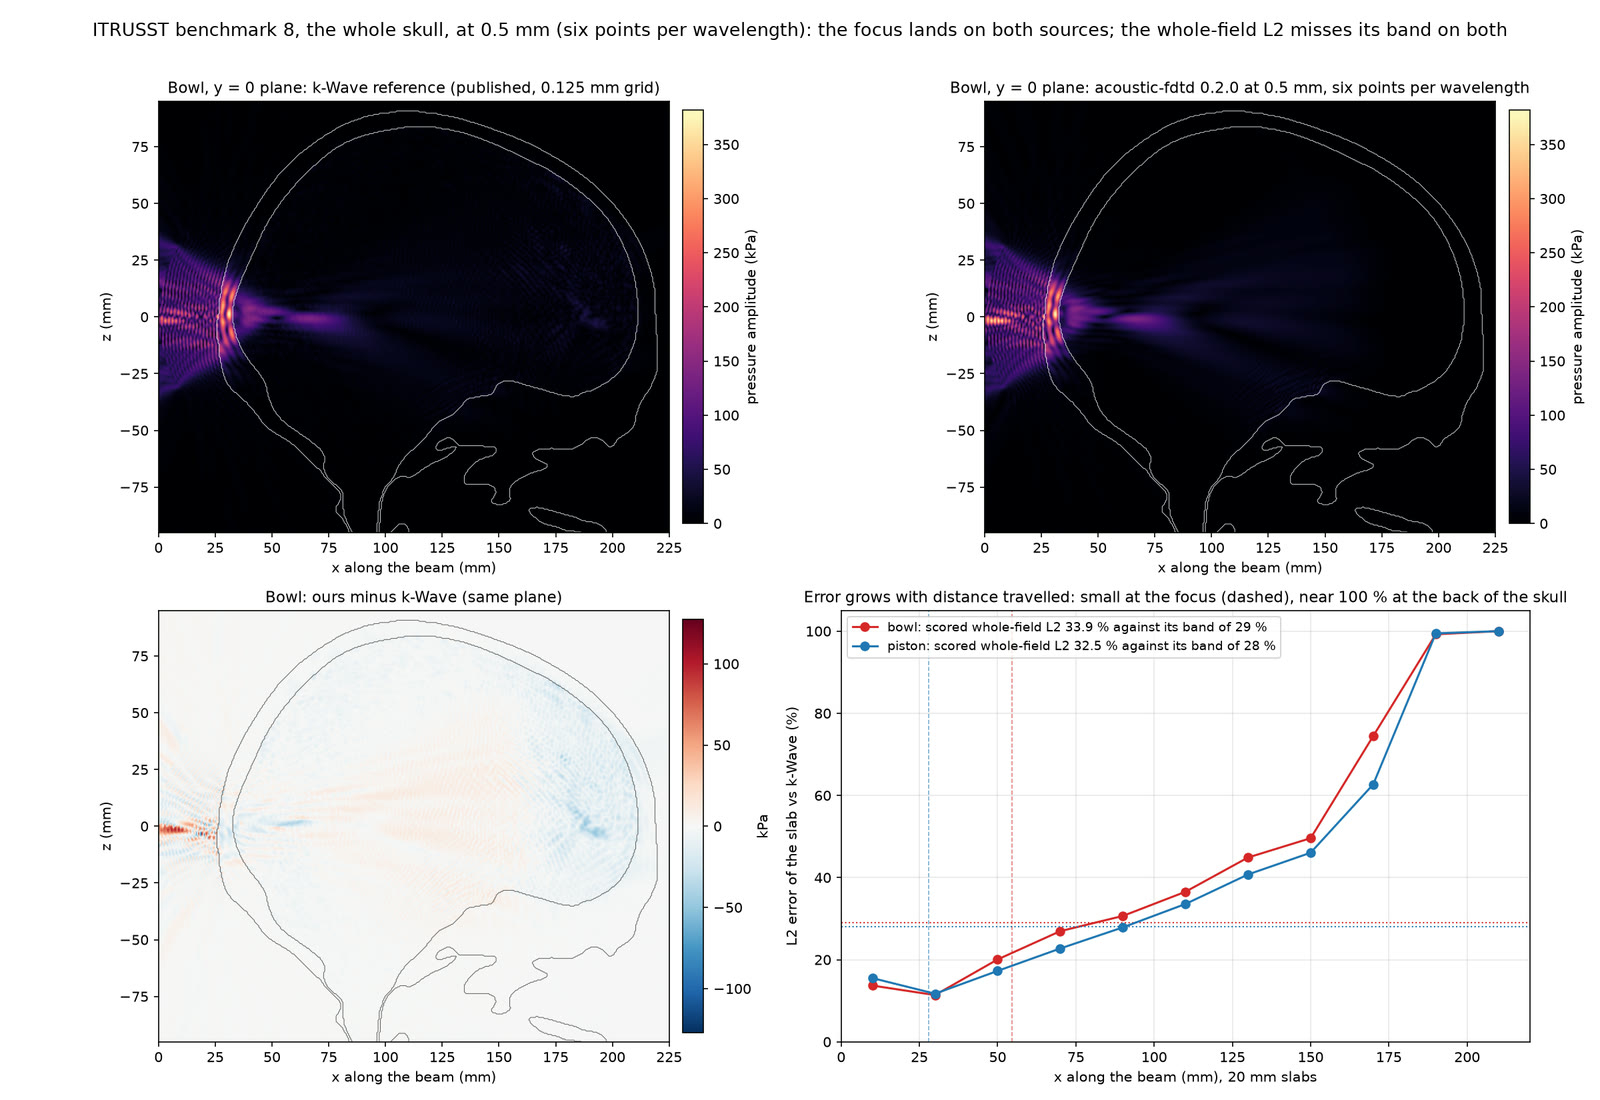
Both solvers still miss the published field
ITRUSST benchmark 8 · Aubry et al. 2022 / k-Wave / Brain Atlas FDTD
Two ultrasound solvers are compared with the published ITRUSST benchmark 8 field in a whole MNI-template skull (Aubry et al. 2022). Brain Atlas's WebGPU finite-difference time-domain (FDTD) code and k-Wave both miss the field comparison on the same grid and skull mask. Checks with finer grids, a different skull mask and longer runs do not remove that mismatch. Its cause remains open. The amplitude estimators differ: the published field uses a Fourier amplitude over its last period, ours uses the last eight periods and k-Wave uses peak pressure over the last eight. The figure is simulated; it is not a patient scan or a treatment result.
Source image · The full source image is shown without cropping.
Source file identity
SHA-256 47f7d523ce91a6cc8f8fdbe61271297bca37135cd1267d2fc49dde02889757b4237,409 bytes
10 / 68.5–74 s · real data + simulated + illustrated
More runners; the learning check still misses
Carter et al. 2024 / AddBiomechanics · Werling et al. 2024 / MyoSuite · MuJoCo · MuscleMimic
MyoFullBody in MuJoCo 3.4, fine-tuned from MuscleMimic mm-10m-2, re-enacts a held-out runner against force-plate measurements (Carter et al. 2024, via AddBiomechanics 1.0; Werling et al. 2024). With the same training budget, each new runner receives roughly a third of the earlier training. The models trained on 33 runners miss the learning check: the slopes relating simulated to measured pelvis travel are +0.17 and +0.23, below the required +0.66. Their held-out measurements are exploratory. One training seed's median absolute error in pelvis travel is 11.9 mm against a constant prediction's 13.6 mm; the other seed's 13.8 mm does not beat it. For the 11.9 mm run, the held-out slope is +0.16 (standard error 0.09), which is not above zero by two standard errors. This does not establish whether more runners help. Simulated knee loads remain about 15 body weights. The generic skeleton's head is omitted.
Source film · Excerpt 0.25–5.75 s.
Source file identity
SHA-256 34cd9a2e91d1e1d4d6fd561fb230561f162956348ed3bb81cf89c437a2182afb1,005,601 bytes
11 / 73.5–81.5 s · simulated + illustrated
Simulated cells persist below the MRI display threshold
MNI152 · Fonov et al. 2011 / HCP1065 tracts · Yeh 2022 / Brain Atlas growth and radiotherapy models
After removal of the enhancing core, this simulated median tumour receives a 60 Gy pencil-beam plan in 30 fractions, with a linear-quadratic model of cell kill. The source covers postoperative days 63–420: simulated cells persist below the model’s MRI display thresholds, then cross them and become visible. These displays use tumour-density thresholds, not measured scans. The run is not fitted to a patient and draws no postoperative mass effect. Anatomy is the MNI152 2009c template (Fonov et al. 2011), through TemplateFlow (Ciric et al. 2022), with HCP1065 context tracts (Yeh 2022). Fluid spaces take no tumour cells. The camera and appearance are illustrated.
Source film · Excerpt 1–9 s.
Source file identity
SHA-256 b1376d49719d8e00485f8b55ce965af7812a260f1d1c754aae18866ff60b800d4,534,557 bytes